

At a glance
Before you start
You need:- A Tableau Cloud or Tableau Server account on the site you want to use.
- Your server address and site, for example
https://prod-uk-a.online.tableau.comand the site namenorthwindfrom/#/site/northwind/. On Tableau Server, the default site has an empty site name. - An allowed integration. An owner or admin sets Tableau to Allow under Admin → Connectors → Catalogue.
- A personal access token. Site administrators can turn token creation on or off under Settings → General → Personal Access Tokens in Tableau Cloud, or in the server settings on Tableau Server.
Permissions
Hebno signs in through the Tableau REST API with your token, so every read uses your own site role and content permissions. These Tableau capabilities decide what Hebno can show:Connect Tableau
1
Create a personal access token
In Tableau, open your profile menu, select My Account Settings, and under Personal Access Tokens enter a token name such as
Hebno and select Create new token. Copy the token secret. Tableau shows it once.2
Start the connection
In Hebno, open Settings → Connections, find Tableau under Data and analytics and select Connect.
3
Enter your details
Enter the server address, site name, token name and token secret, then select Connect. Hebno signs in to check the token.
4
Return to Hebno
The card shows Connected with your Tableau site and username.
What Hebno reads
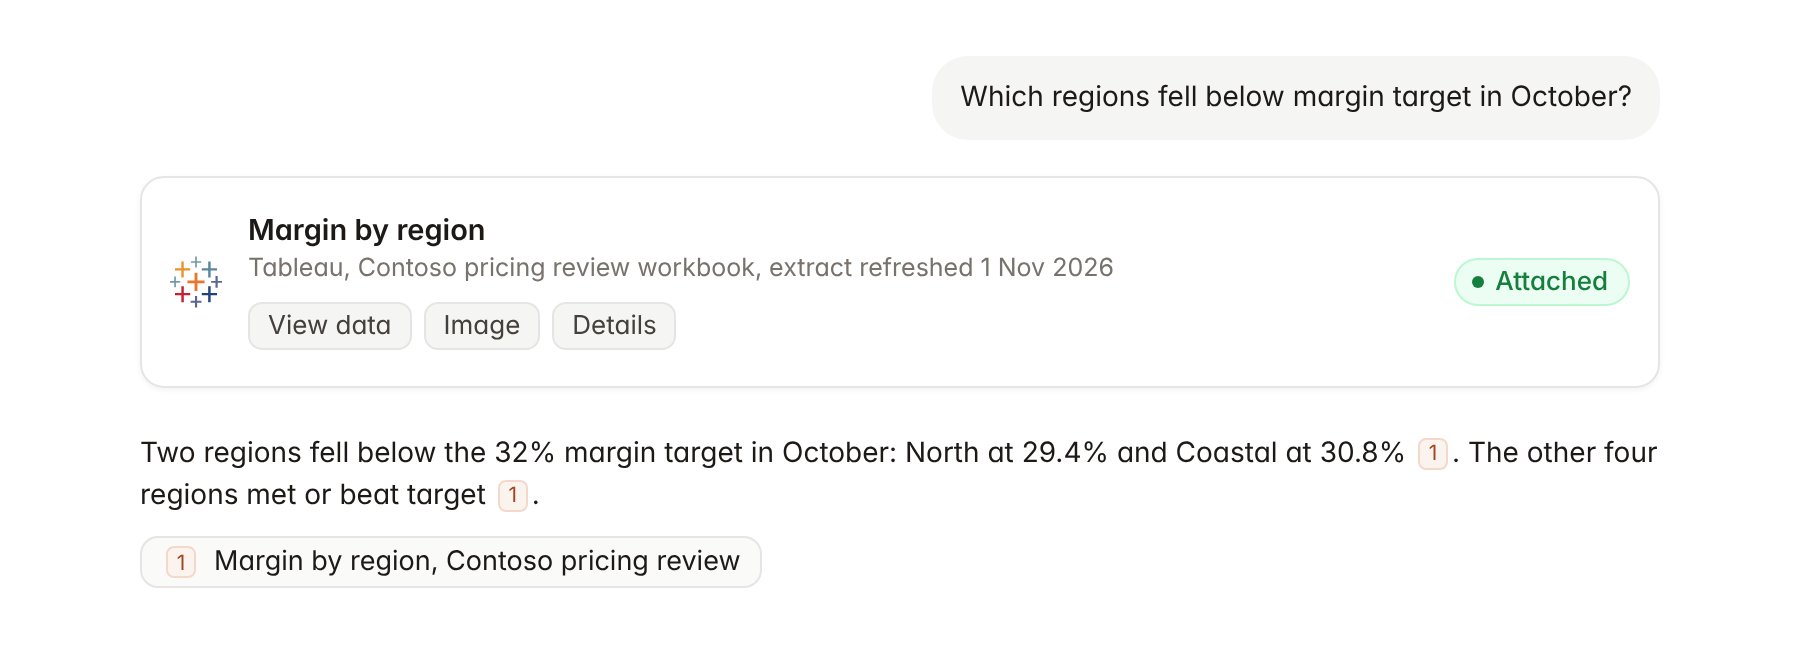
A Tableau view attached to a chat.
Hebno reads only
Hebno does not write to Tableau. It does not publish, edit or delete workbooks, refresh extracts, change permissions or create subscriptions.Link a project to a workbook
Linking marks which Tableau workbooks or views belong to an engagement, so you can ask “how is margin tracking?” without naming the dashboard.- Open the project and select Brain.
- Under Linked records, select Link record, then Tableau.
- Search by workbook or view name and select it. Repeat for each workbook in the engagement.
Use Tableau in chat
-
Attach: open the + menu, choose Sources → Tableau, and pick a workbook, a view or a data source. Or type
/and choose Tableau. -
Ask: name the dashboard, metric or filter in your request. For example:
Using the Contoso margin by region dashboard, which regions fell below target in October?
Pull the store sales by category view for November and draft three findings for the steering committee.
Which data source feeds the price elasticity workbook, and when was it last refreshed?
- Research runs show a Checking Tableau step, with a chip for each workbook, view and data source it read.
- Agents can read Tableau on a schedule, for example a Monday summary of the Contoso margin dashboard. Writes an agent proposes elsewhere appear in agent approvals for review.